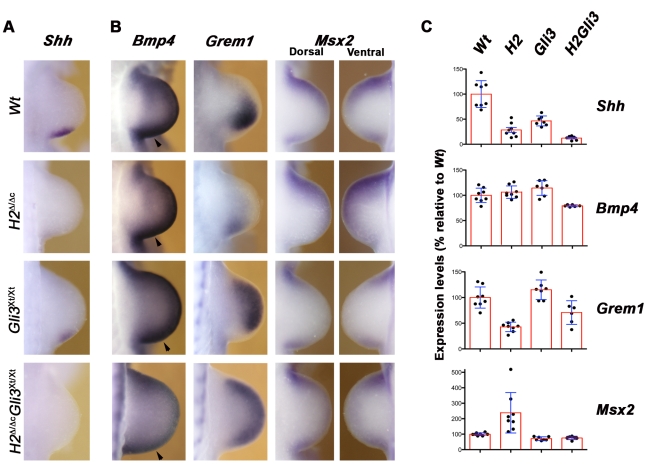
Figure 6. Shh expression and BMP pathway activity in H2 Δ/Δc and H2 Δ/Δc Gli3 Xt/Xt forelimb buds.
(A) No Shh expression is detected in the posterior mesenchyme of H2 Δ/Δc and H2 Δ/Δc Gli3 Xt/Xt limb buds at E10.25 (32–33 somites). (B) Bmp4, Grem1, and Msx2 expression at E10.5 (34–35 somites). Note that Grem1 expression is activated, but not up-regulated and expanded distal-anterior in H2 Δ/Δc limb buds. In contrast, the Grem1 expression domain appears rather uniform in the majority of all H2 Δ/Δc Gli3 Xt/Xt limb buds. (C) Q–PCR quantitation of Shh, Bmp4, Grem1 and Msx2 expression in single limb buds of mouse embryos of the indicated genotypes at ∼E10.5 (34–37 somites). Boxes show the average (± standard deviation), dots indicate levels in individual limb bud determined by triplicate analysis. The vertical axis indicates expression levels in percentages of wild-type levels (wild-type average set at 100%). Wt: wild-type (n = 8 single limb buds analyzed); H2: H2 Δ/Δc (n = 8); Gli3: Gli3 Xt/Xt (n = 7); H2Gli3: H2 Δ/Δc Gli3 Xt/Xt (n = 6). All differences discussed in the text are statistically highly significant (p-values between p<0.001 and p<0.05 using Mann-Whitney tests).

