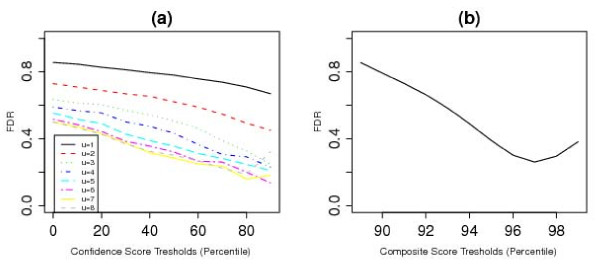
Figure 6.
Comparison to McCarroll's CNVs. (a) Discordance rates when comparing regions found using COVER and those found by McCarroll et al., plotted against confidence score thresholds for different values of u. (b) Discordance rates when comparing regions found using COMPOSITE and those found by McCarroll et al., plotted against composite score thresholds.

