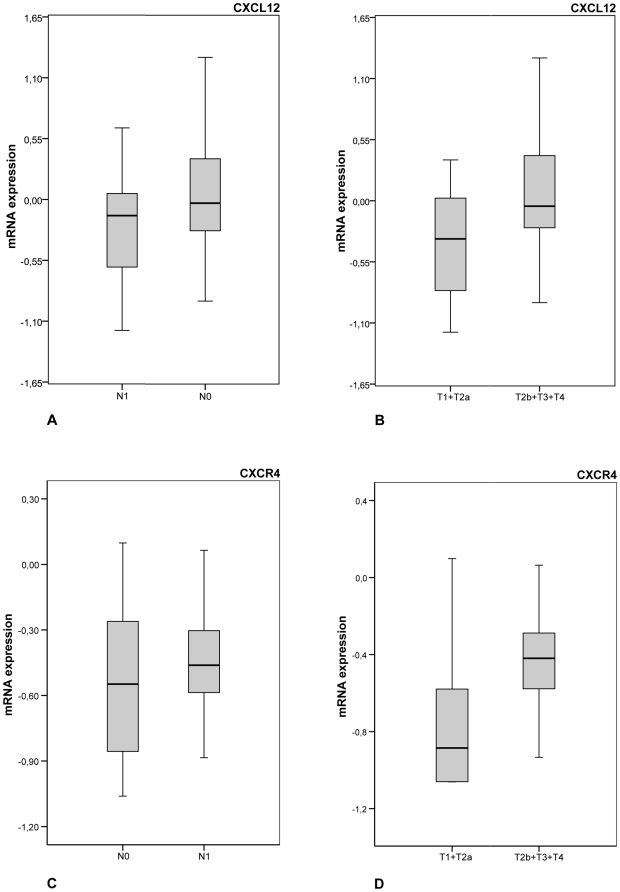
Figure 1. Transcription of CXCL12 and CXCR4:
Boxplots depicting overall distribution of CXCL12 in (a) nodal negative versus nodal positive gastric carcinomas and in (b) pT1/T2a versus pT2b/T3/T4 gastric carcinomas. Overall distribution of CXCR4 in (c) nodal negative versus nodal positive gastric carcinomas and (d) pT1/T2a versus pT2b/T3/T4 gastric carcinomas. Box boundaries: 25th and 75th percentiles; solid line: median; whiskers: 10th and 90th percentiles.

