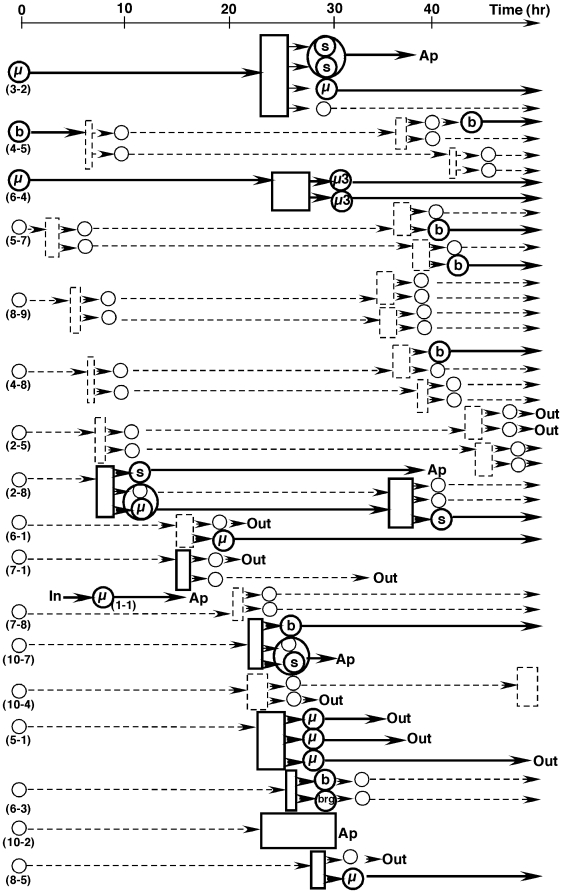
Figure 1. Chronological chart that summarizes a representative time-lapse experiment.
Cells were seeded in poly-D-lysine coated glass-bottom dishes and HU was added to the culture (150 µM). After 24 hours time-lapse image acquisition was started for this representative experiment. Six images (1.4 µm apart in the z-axis) were taken for both green fluorescence and phase contrast at 20 min intervals over 48 hours. Each nucleus was numbered (in parenthesis at time 0) by its position on the gridded field at the start time and is indicated by a circle in the figure. Cells with a micronucleus (µ) or buds (b) are noted in appropriate circles. Mitosis is marked as a rectangle, whose width corresponds to its duration. Tripolar or tetrapolar mitoses are drawn as three or four arrows emanating from the mitosis rectangles. As a result of multipolar mitosis, a multinucleated cell (surrounded by a larger oval) or a small nucleus appeared frequently. During the experiment, some cells moved out of the field (out) and some cells entered the field (in). Normal events are shown as dashed lines, whereas abnormal events are highlighted in bold lines. Ap, apoptosis; s, small nucleus; brg, chromatin bridge.

