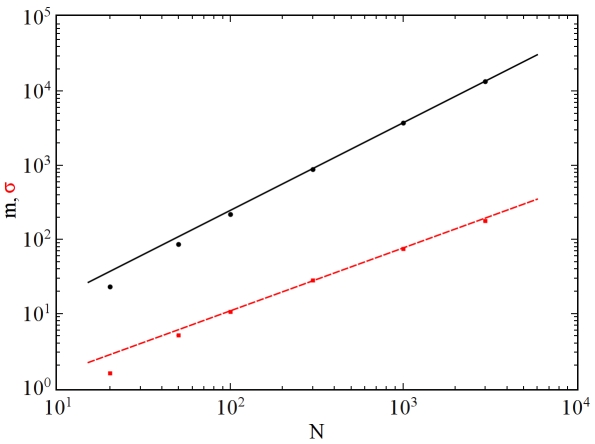
Figure 2. Mean  and standard deviation
  of the distributions of the logarithm of the weights vs. number of nodes
  of samples from an ensemble of power-law sequences with
  .
.
The black circles correspond to  , the red squares correspond to
  . The error bars are smaller than the symbols. The solid black line and the dashed red line show the outcomes of fits on the data. The linearity of the data on a logarithmic scale indicates that the
  and
and  follow power-law scaling relations with
  :
:  and
and  . The slopes of the fit lines are an estimate of the value of the exponents:
  and
and  .
.

