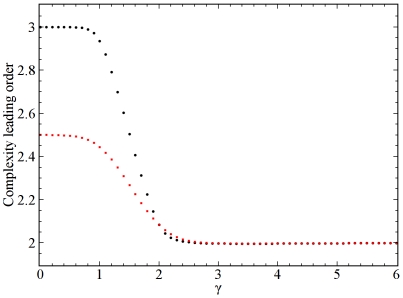
Figure 3. The estimated computational complexity of the algorithm for power-law sequences.
The leading order of the computational complexity of the algorithm as a power of  , where
  is the number of nodes, is plotted as a function of the degree distribution power-law exponent
  . The black circles correspond to ensembles of sequences without cutoff, while the red squares correspond to ensembles of sequences with structural cutoff in the maximum degree of
  . The fits that yielded the data points were carried out considering sequences ranging in size from
  to
to  .
.

