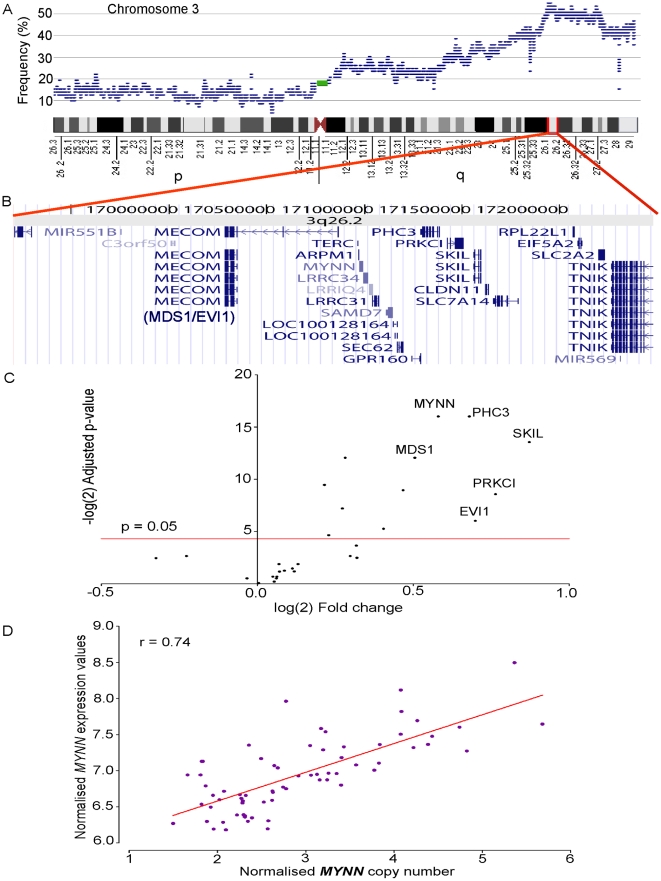
Figure 3. Correlation between copy number and expression for a frequently gained region on cytoband 3q26.2.
A. Frequency of copy number gain on chromosome 3 from p-ter at left to q-ter at right as indicated by the ideogram. B. Genes on Chr3: 169.209–172.478 Mbp, a region gained in 60% (41/68) of all samples, including genes previously associated with ovarian cancer (PRKCI, MECOM or MDS1/EVI1) and potentially novel oncogenes (MYNN). C. A volcano plot presenting the results of expression analyses between amplified and unamplified samples in this region. The genes in the top right corner are significantly overexpressed in samples with copy number gain (p<0.05; above the red line at –logP 4.32) compared to samples without copy number change (selected genes are labelled). For full list of differentially expressed genes see Table S5. D. Plot comparing copy number and expression in all samples for the gene MYNN that showed the highest correlation (r = 0.74, Pearson's test) between copy number and expression for this region on 3q26.2.

