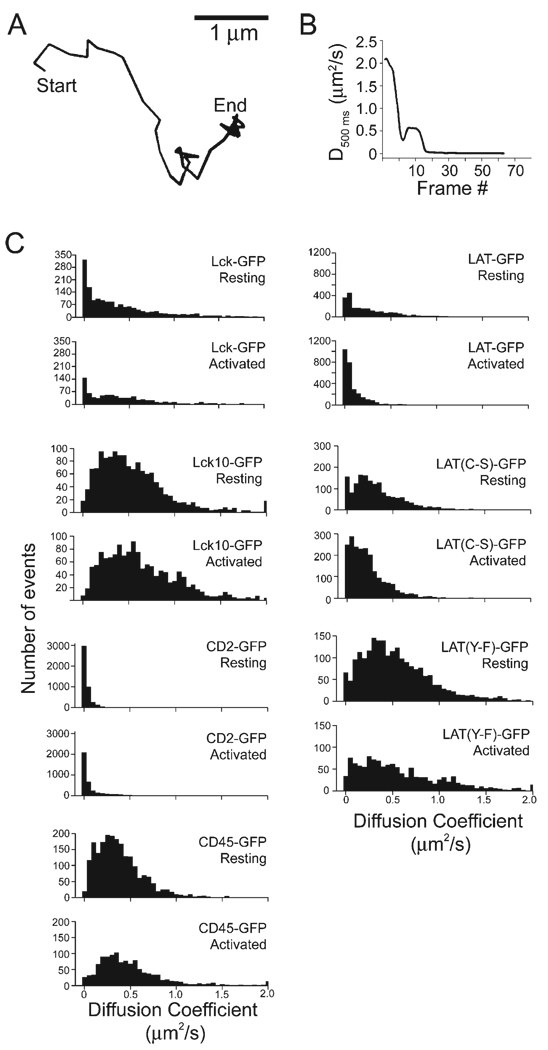
Figure 2. Diffusional Immobilization and Response to TCR Signaling for Several GFP-Tagged Signaling Molecules.
(A) and (B) illustrate the experimental determination of diffusion coefficients. In (A), a representative single-molecule trajectory is shown (duration = 2.90 s).
(B) shows the diffusion coefficients for this trajectory, by generating mean square displacement versus time plots (0.5 s) for each sequential frame (see Experimental Procedures).
(C) Histograms of diffusion coefficients are shown for unstimulated and TCR-activated cells for Lck-GFP, Lck10-GFP, LAT-GFP, LAT(C-S)-GFP, LAT(Y-F)-GFP, CD2-GFP, and CD45-GFP. Average values are reported in Table S1.

