
Figure 2. Retinyl Esters in Retina and RPE.
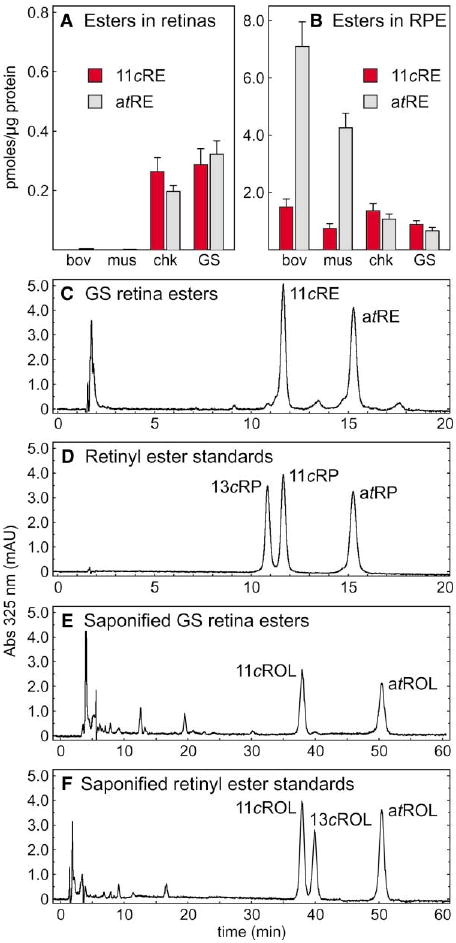
(A) Levels of 11-cis-retinyl esters (11cRE, red bars) and all-trans-retinyl esters (atRE, gray bars) in bovine (bov), mouse (mus), chicken (chk), and ground squirrel (GS) retinas. (B) Levels of 11-cis-retinyl esters and all-trans-retinyl esters in RPE from the four species. Values are shown as pmols per μg protein in microsomal membranes. Error bars show standard deviations (n = 4). (C) Representative HPLC chromatogram of retinyl esters from ground squirrel retina. (D) Representative HPLC chromatogram of the retinyl-ester standards: 13-cis-retinyl palmitate (13cRP), 11-cis-retinyl palmitate (11cRP), and all-trans-retinyl palmitate (atRP). (E) Representative chromatogram of saponified retinyl esters from GS retina showing 11-cis-retinol (11cROL) and all-trans-retinol (atROL). (F) Representative chromatogram of saponified retinyl-ester standards showing 11-cis-retinol, 13-cis-retinol (13cROL), and all-trans-retinol. UV absorption at 325 nm is shown in milliabsorption units (mAU).