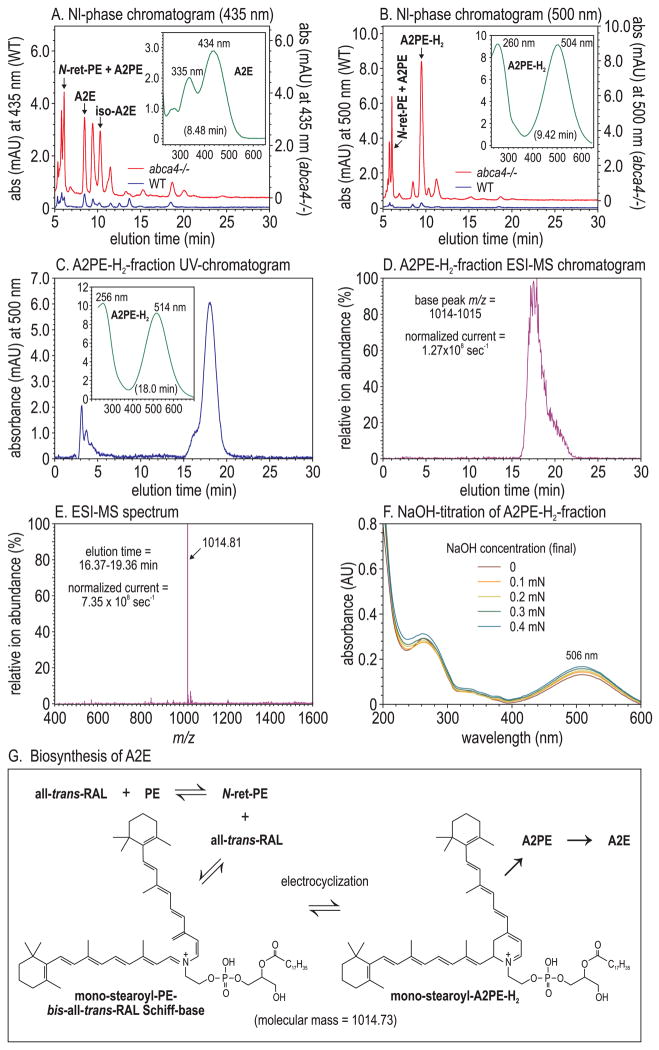
Figure 2.
Liquid-chromatographic and mass-spectrometric analysis of A2PE-H2. (A) Normal-phase chromatograms at 435 nm eyecup-homogenate extracts from 8-month-old wild-type (blue) and abca4−/− (red) mice. A2E and iso-A2E peaks are labeled. Inset: UV spectrum of the A2E peak. (B) Normal-phase chromatograms at 500 nm of the same samples as in (A). The abca4−/−-dependent 500-nm peak is labeled A2PE-H2. Inset: UV spectrum of the A2PE-H2 peak. (C) Reverse-phase chromatogram at 500 nm of the A2PE-H2 peak-fraction (9.42 minutes) collected during normal-phase chromatography of abca4−/− eyecup homogenates (B). Inset: UV spectrum of the 18-minute (A2PE-H2) peak. (D) ESI-MS chromatogram of the sample in (C) showing the relative abundance of positive ions with 1014 to 1015 m/z. The ion current at 100% is 1.27 × 10⁸/s. (E) MS showing the relative abundance of ions detected during the 16.37- to 19.36-minute elution interval. The ion current at 100% is 7.35 × 10⁸/s. Note the near homogeneity of the 1014.81 ion. (F) Spectra of the A2PE-H2 peak fraction from (B) acquired after the addition of the indicated (final) concentrations of NaOH. (G) Molecular structure of mono-stearoyl-A2PE-H2 in equilibrium with the open-ring isomer (mono-stearyl-phosphatidylethanolamine-bis-all-trans-RAL Schiff base).

