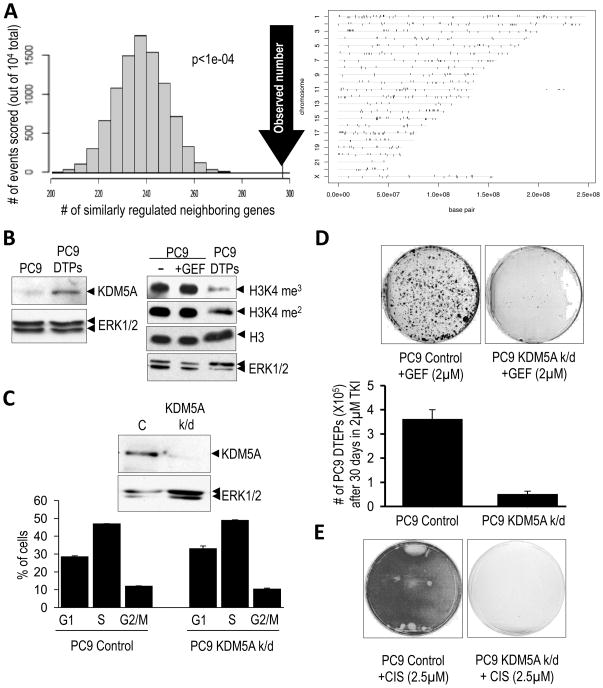
Figure 3. Chromatin alterations and a requirement for the KDM5A histone demethylase in the drug-tolerant state.
(A) Non random expression differences between PC9 cells and PC9-derived DTEPs, indicative of global chromatin alterations. (Left panel) Non-random chromosomal arrangement of differentially up-regulated and down-regulated genes from an array analysis of PC9 cells versus PC9-derived DTEPs was revealed by counting the number of neighboring differentially expressed genes that are either both up-regulated or both down-regulated (104 total pairs examined). The distribution on the graph indicates the expected frequency of similarly regulated neighboring genes, assuming no relationship between expression status and chromosomal configuration, and the arrow indicates the observed number of neighboring genes that are similarly regulated. The p-value reflects the statistical likelihood that the observed number is different than the expected number. (Rght panel) Vertical ticks show the locations along different chromosomes of genes differentially expressed between PC9 cells and PC9-derived DTEPs (tolerant to either gefitinib or erlotinib). Genes whose expression is elevated in both the gefitinib- and erlotinib-tolerant PC9 cells (relative to untreated PC9) are shown above the horizontal lines corresponding to the chromosomes and genes whose expression is attenuated in these cells are shown below the horizontal lines. Individual genes are represented by vertical ticks of equal width. Consequently, ticks that appear wide represent a closely spaced cluster of genes.
(B) The left panel shows increased expression of KDM5A in PC9-derived DTPs, relative to ERK1/2 as a loading control. The right panel shows the decrease in histone H3K4 methylation (H3K4 me3/2) in PC9-derived DTPs compared to parental PC9 cells either untreated (−) or treated for 20 hours with 2μM gefitinib (GEF), with total histone H3 and ERK1/2 serving as loading controls.
(C) (Upper panel) Immunoblot demonstrating reduced expression of KDM5A in PC9 cells lentivirally-infected with shRNA targeting KDM5A (KDM5A k/d) compared to PC9 cells infected with a control shRNA (C). (Lower panel) Cell cycle profiles of these cells as assessed by FACS. Bar graphs represent 2 experiments performed in duplicate.
(D) PC9 cells infected with control or KDM5A (KDM5A k/d) shRNAs were plated at equal density and treated with 2μM gefitinib (GEF) for 30 days with media/drug changes every 3 days. Surviving cells were counted (lower panel) or Giemsa stained and photographed (upper panel). Graphs represent two independent experiments performed in duplicate.
(E) PC9 cells transduced with control or KDM5A (KDM5A k/d) shRNAs were plated at equal density and then treated with 2.5μM cisplatin with media changes ever 2 days. Plates were Giemsa stained 12 days post-treatment.

