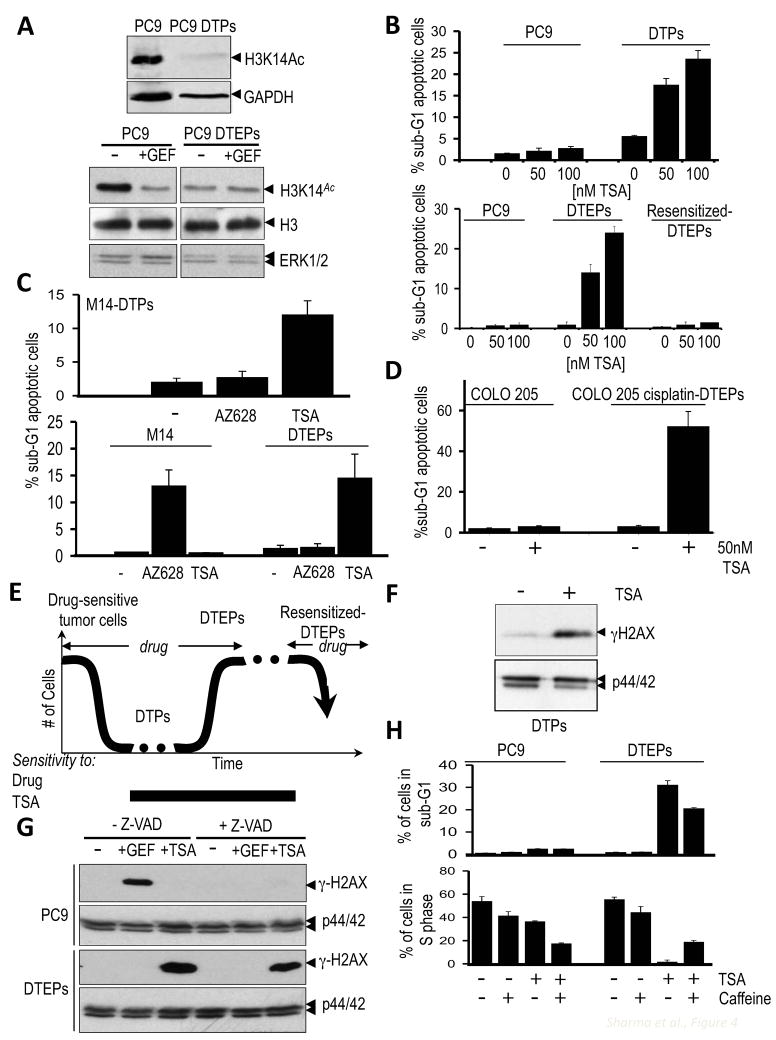
Figure 4. Drug-tolerant cancer cells are sensitive to HDAC inhibition.
(A) (Upper panel) Immunoblot demonstrating reduced H3K14 acetylation in PC9-derived DTPs treated with 2μM gefitinib. GAPDH serves as a loading control. (Lower panel) Immunoblots to detect histone H3K14 acetylation in PC9 cells and PC9-derived DTEPs either untreated (−) or treated for 24h with 1μM of gefitinib (+GEF). Total histone H3 (H3) and ERK1/2 serve as loading controls.
(B) (Upper panel) Sensitivity of PC9 cells and PC9-derived DTPs to Trichostatin A (TSA). Cells were plated at the same density and either untreated or treated with the indicated TSA concentrations for 20 hours, after which cells were subjected to FACS analysis. Graphs indicate the percentage of dying cells in the population (sub-G1 DNA content), based on 2 independent experiments. (Lower panel) TSA sensitivity of PC9 cells, PC9-derived DTEPs and re-sensitized DTEPs (cells that re-acquired sensitivity to EGFR TKIs following 30+ passages in drug-free medium). Cells were either untreated or treated with the indicated TSA concentrations for 24 h, after which they were subjected to FACS analysis. Presented in the graph is the percentage of dying cells with sub-G1 DNA content, based on 3 independent experiments. Error bars represent standard deviations from the mean.
(C) (Upper panel) TSA sensitivity of M14-derived DTPs. Parental M14 melanoma cells and M14-derived DTPs were plated at equal densities and were either untreated (−), treated with 2μM AZ628 or 100nM TSA for 36 hours, after which they were subjected to FACS analysis. Indicated in the graph is the percentage of cells that display a sub-G1 DNA content indicative of apoptotic cells. The values presented are the average of 2 separate experiments. Error bars represent standard deviations from the mean. (Lower panel) TSA sensitivity of M14 and M14-derived DTEPs to AZ628 and TSA. M14 cells or M14-derived DTEPs were plated at equal density and were either untreated (−), treated with 2μM AZ628 or 100nM TSA, and then analyzed as described above. The values presented are the average of 2 separate experiments. Error bars represent standard deviations from the mean.
(D) COLO 205 colorectal cancer cells or cisplatin-tolerant COLO 205 cells were plated at equal density and were either untreated (−) or treated with 50 nM TSA. 36 hours post-plating cells were subjected to FACS analysis. Indicated in the graph is the percentage of cell with a sub-G1 DNA content indicative of apoptosis. The values presented are the average of 2 separate experiments. Error bars represent standard deviations from the mean.
(E) Model describing the emergence and reversibility of drug-tolerant cancer cells from a largely drug-sensitive population.
(F) Lysates from PC9-derived DTPs either untreated (−) or treated with 50nM TSA for 20 hours were analyzed by immunoblotting using antibodies directed against γH2AX and ERK1/2 as a loading control.
(G) PC9 cells and PC9-derived DTEPs were either untreated (−), treated for 24h with 1μM gefitinib (+GEF) or 50 nM TSA (+TSA), in the presence or absence of the caspase inhibitor, Z-VAD, and lysates were analyzed by immunoblotting using antibodies directed against γ-H2AX. p44/42 ERK was immunoblotted as a loading control.
(H) PC9 cells and PC9-derived DTEPs were either untreated, treated with 2mM caffeine, 75nM TSA alone or, 75nM TSA + caffeine for 36h, after which cells were subjected to FACS analysis. Indicated on the plot is the percentage of cells displaying sub-G1 DNA content (apoptotic cells; top histogram) and the percentage of cells in S phase (bottom histogram).

