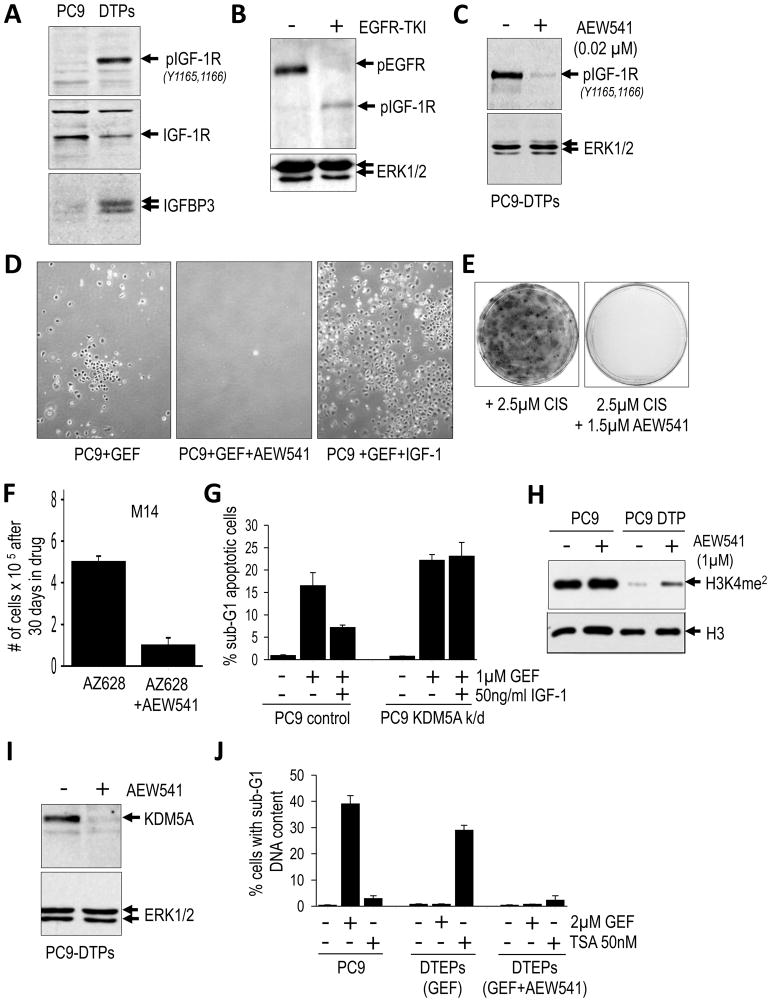
Figure 7. IGF-1R activity is required for the chromatin state in drug tolerant cells.
(A) Immunoblot demonstrating phosphorylation of IGF-1R and expression of IGFBP3 in DTPs versus parental PC9 cells. Total IGF-1R is shown as a loading control.
(B) Immunoblot of extracts from an erlotinib-treated (or untreated) mouse lung tumor from transgenic mice expressing an activating EGFR mutant. After 2 days of treatment, EGFR phosphorylation is reduced, and phospho-IGFR is detected in residual tumor material. ERK1/2 is shown as a loading control.
(C) Immunoblot demonstrating reduced phosphorylation of IGF-1R following treatment with 1μm of the IGF-1R inhibitor AEW541 for 2 hours. ERK1/2 is used as a loading control.
(D) Photomicrographs of PC9-derived DTPs following 4 rounds of treatment (12 days) with 1μM gefitinib (GEF), 1μM gefitinib plus 1μM AEW541, or 1μM gefitinib plus 50ng/ml human IGF-1. Representative fields are shown.
(E) PC9 cells were treated with 2.5μM cisplatin or 2.5μM cisplatin in combination with 1μM AEW541. After 30 days the plates were Giemsa stained. A representative example is shown.
(F) M14 melanoma cells were treated with 2μM AZ628 or 2 μM AZ628 in combination with 1μM AEW541 in triplicate. After 30 days cells were counted and the bar graphs reflect the number of remaining cells per dish. Error bars represent standard deviations from the mean.
(G) PC9 cells and PC9 cells in which KDM5A was stably depleted by shRNA (k/d) were either untreated or treated with gefitinib (GEF) or gefitinib plus IGF-1 for 48 hours and then analyzed by FACS to determine the percentage of cells with a sub-G1 content (apoptotic). Graphs reflect the average of two independent experiments performed in duplicate. Error bars represent standard deviations from the mean.
(H) Immunoblot of extracts from parental PC9 cells or PC9-derived DTPs plated at equal density and treated with 1μM of AEW541 for 16 hours. Note that H3K4me2 (dimethylated) levels increase upon addition of AEW541 to PC9-derived DTPs.
(I) Immunoblot of lysates from PC9-derived DTPs either untreated or treated with 1μM of AEW541 for 24 hours. ERK1/2 is shown as a loading control.
(J) PC9 cells, PC9-derived DTEPs (gefitinib-treated), or PC9-derived DTEPs (gefitinib- and AEW541-treated) were either untreated or treated with gefitinib (GEF) or TSA for 48 hours and then BrdU labeled and analyzed by FACS to determine the percentage of cell with a sub-G1 content (apoptotic). Graphs reflect the average of two independent experiments performed in duplicate. Error bars represent standard deviations from the mean.

