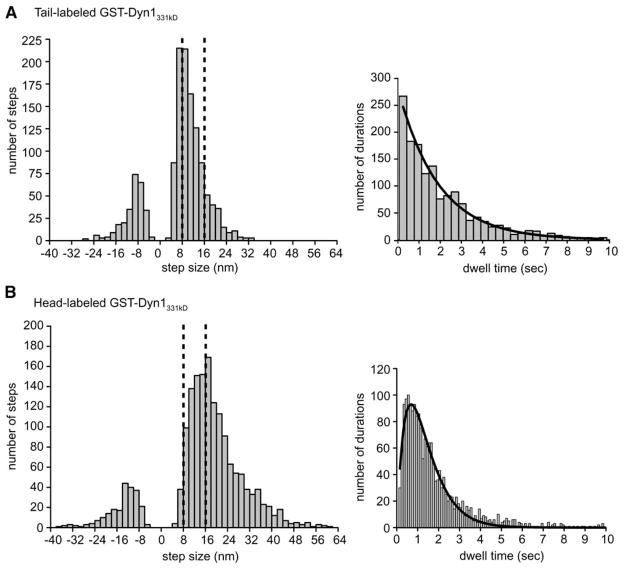
Figure 5. Histograms of Dynein Step Sizes and Dwell Times.
(A) A histogram of tail-labeled Qdot-GST-Dyn1331 kDa step sizes reveals a major peak at ~8 nm with a considerable tail of longer steps. Included in the histogram are 1342 steps from 27 moving dynein molecules. Backward steps make up 20% of the total. A histogram of dwell times between steps is fit with a single exponential function, and the decay constant reveals a stepping rate (k) of 0.13 ± 0.01 per second per μM ATP.
(B) A histogram of head-labeled GST-Dyn1331 kDa-Qdot step sizes reveals a major peak at ~16–18 nm with a considerable tail of longer steps. Included in the histogram are 1690 steps from 29 moving dynein molecules. Backward steps make up 13% of the total steps. The dwell-time histogram is fit with a convolution of two exponential functions with equal decay constants (the fit indicates a dynein stepping rate (k) of 0.14 ± 0.01 per second per μMATP).

