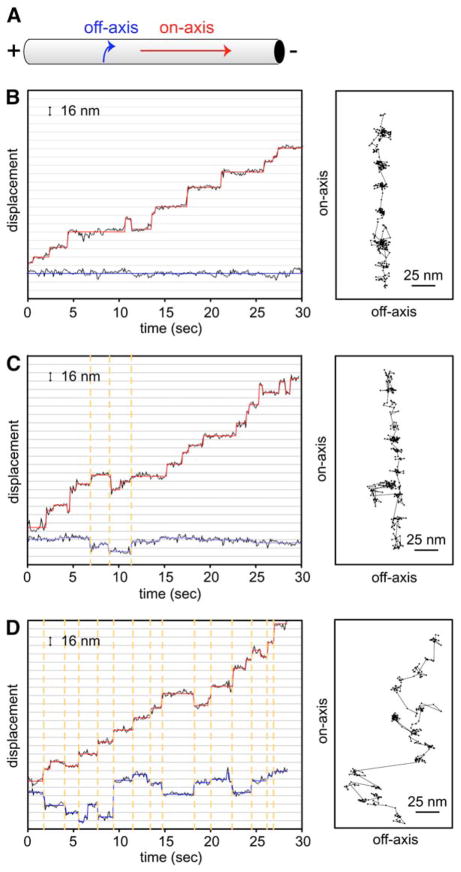
Figure 6. Dynein Can Step to Neighboring Protofilaments.
(A) Diagram of an axoneme and the direction of on-axis (red arrow) and off-axis (blue arrow) movement.
(B–D) Three examples of on-axis (parallel to the microtubule long axis) and off-axis (perpendicular to the microtubule long axis) stepping by head-labeled GST-Dyn1331 kDa-Qdot. (B) shows an example of no off-axis stepping, (C) shows the most typical trace of a few off-axis steps, and (D) shows a rare trace of many large off-axis displacements. On-axis stepping position is represented by the black circles (raw data), and the red line shows a fit with the step-finding program, whereas off-axis stepping position is represented by blue circles (raw data) and lines. Dashed orange lines illustrate that on- and off-axis steps occur simultaneously. The panels on the right depict off-axis (x axis) versus on-axis (y axis) movements. The direction of movement is toward the top of the page. Each step is represented by a black circle, and the steps are connected with a black line. See Figure S10 for additional traces and discussion of off-axis displacement.

