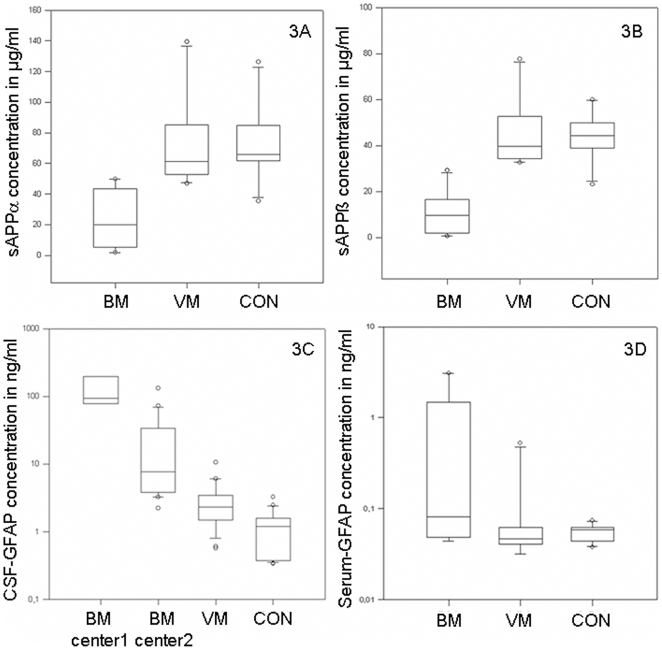
Figure 3. GFAP and sAPPα/β - Data of the ELISA and Multiplex.
Boxplots of sAPPα (3A) as well as sAPPβ levels (3B) in CSF of patients with BM, VM and CON are indicated. Part 3C and 3D demonstrates GFAP-levels in CSF (3C) and serum (3D). In CSF, the comparison between center one and center two is indicated for BM. Plot shows 10th, 25th, 50th, 75th, and 90th percentiles and outliers.

