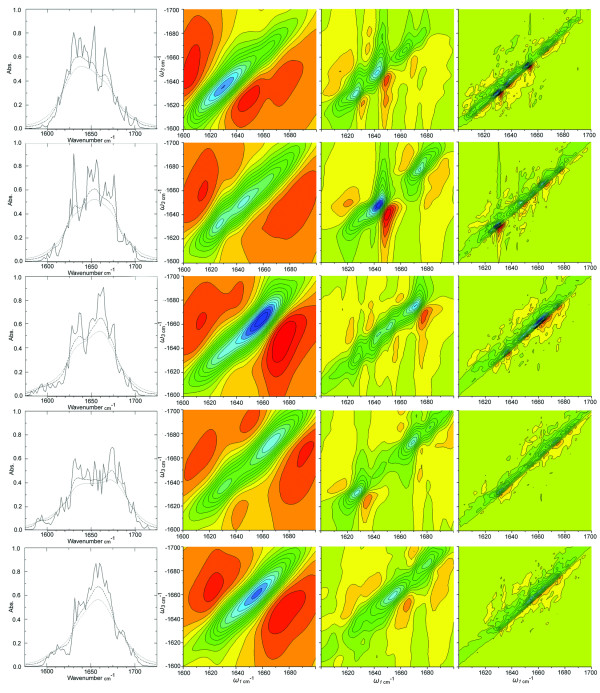
Figure 3.
The simulated 2DIR spectrum of Beta3s. Right: The linear absorption spectra for investigated conformations of Beta3s calculated with homogenous broadening parameters 1 cm-1 (solid line), 5 cm-1 (dashed line) and 10 cm-1 (dotted lines). Bottom axis is absorbance in cm-1 and side axis is absorbance. a) native b) 6-12 Helix c) Cs d) Ns and e) Ch-Curl. Left: The 2DIR spectra for the kI experimental parameters for each conformation of Beta3s. Columns left to right represent line width parameters (Γ) 1 cm-1 (left), 5 cm-1 (middle) and 10 cm-1 (right). Rows indicate data for each of the conformations top to bottom native, Ns, Cs, Ch-Curl, 6-12 Helix.

