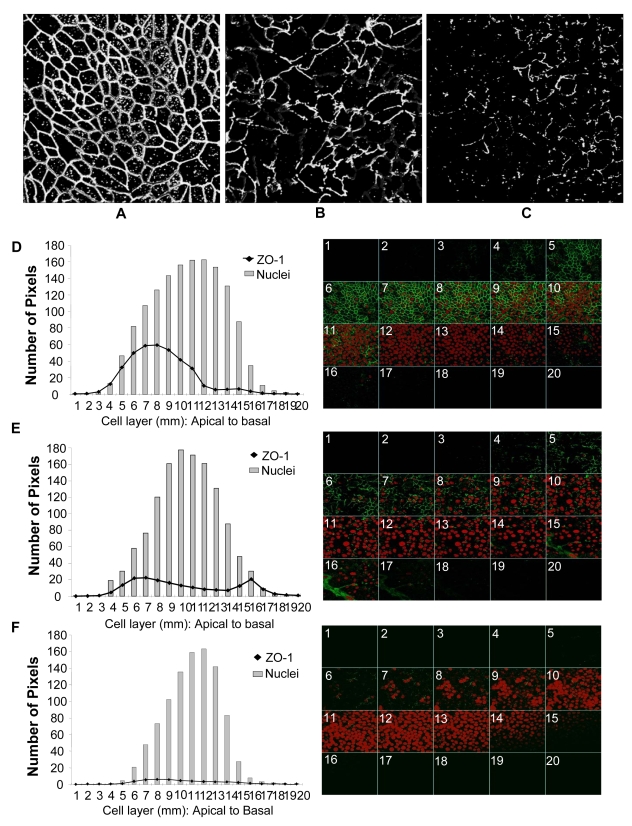
Figure 4. Genital EC monolayers were fixed after 4 or 24 hours post-HIV-1 exposure and stained for ZO-1 (green) and nucleus (red).
A–C. Series of stack planes (XY) taken through the apical extent of the monolayer. D–F. Quantification of ZO-1 (dark line) and nuclear (grey bars) staining shown as graphs. Each cell layer (1–20) corresponds to series of images from Z-stack sections taken at 1µm thickness through the cell monolayer shown on the right. X-axis illustrates cell layers from apical to basolateral. Y-axis illustrates the number of pixels present over the entire area of image. A, D. Control mock infected monolayer, 24 hours post-treatment. B,E. HIV-1 exposed monolayer, 4 hours post-treatment. C,F. HIV-1 exposed monolayer, 24 hours post-treatment. Results shown are representative of 3 separate Z-stacks collected and analyzed from each replicate, each treatment group had 3–5 replicates and the experiment was repeated 3 times. (Magnification :1260×).

