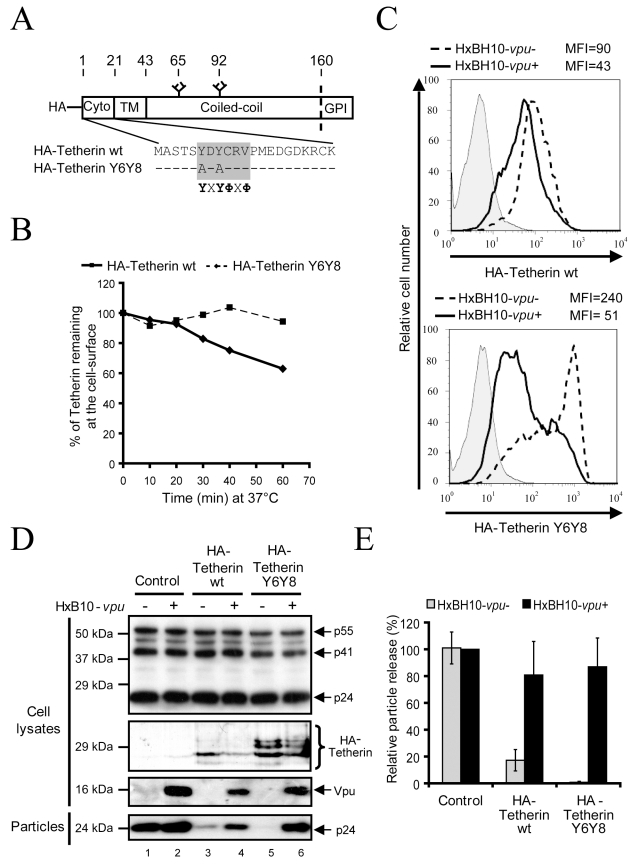
Figure 3. Mutation of Tetherin dual Tyrosine-based sorting motif does not affect sensitivity to Vpu.
(A) Schematic representation of HA-Tetherin wt and HA-Tetherin Y6Y8. The overlapping Tyr-based motifs are presented in the grey box. X and Φ correspond to variable and hydrophobic amino-acid residues, respectively. Hyphens represent unchanged amino-acids. The site that is cleaved prior to addition of the GPI lipid anchor is represented by the dashed line. Glycosylation sites are represented at position 65 and 92. (B) Kinetics of HA-Tetherin Y6Y8 internalization. HEK 293T cells were co-transfected with the indicated HxBH10 constructs and a GFP-expressing plasmid. Forty-eight hours post-transfection, cell-surface Tetherin was labeled with Tetherin specific Abs at 4°C before incubating cells at 37°C for the indicated time intervals to allow endocytosis. Cells were then incubated at 4°C in presence of appropriate secondary Abs. The graph depicts the relative levels of Tetherin at the surface of GFP-expressing cells (time 0 = 100%) and represents the loss of Tetherin-specific signal following endocytosis. (C) Cell-surface expression of HA-Tetherin Y6Y8. HEK 293T cells were co-transfected with the indicated HA-Tetherin plasmid and HxBH10 proviral constructs in presence of a GFP-expressing plasmid. Cell-surface Tetherin expression was analyzed on GFP-positive cells by flow cytometry 48 h post-transfection. Geo mean values (depicted as MFI) are shown. Full lines: HxBH10-vpu+; dashed lines: HxBH10-vpu-; filled histogram: pre-immune control. The results are representative of two independent experiments. (D) Effect of HA-Tetherin Y6Y8 on HIV-1 particle release. HEK 293T cells were co-transfected with the indicated HxBH10 proviral constructs and HA-Tetherin-expressing plasmids. Forty-eight hours post-transfection, transfected cells and virus-containing supernatants were harvested. Proteins from cell and viral lysates were analyzed by western blot using specific Abs. (E) Quantitation of HIV-1 particle release. Bands corresponding to Gag products in cells and viral particles were scanned by laser densitometry. The virus particle release efficiency was determined as described in the Materials and Methods and calculated as a percentage of the release of HxBH10-vpu+ (100%) in absence of HA-Tetherin. Error bars indicate the standard deviation of the mean from two independent experiments.

