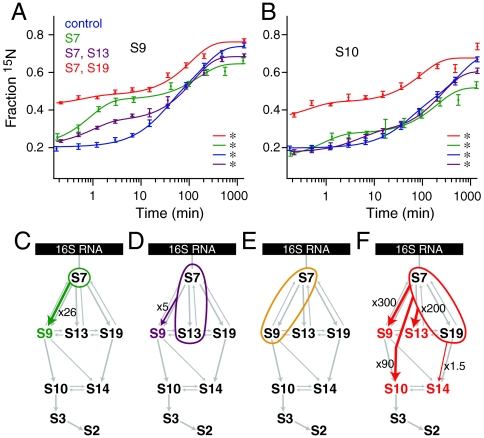
Fig. 4.
(A)–(B) Protein binding progress curves for proteins (A) S9 and (B) S10 from a control experiment (Blue), prebinding of S7 (Green), prebinding of S7 and S19 (Red), and prebinding of S7 and S13 (Purple). Double exponential curves are indicated with an asterisk. (C)–(F) Kinetic assembly maps of the 3′ domain only from experiments prebinding (C) S7 alone, (D) S7 and S13, (E) S7 and S9, (F) S7 and S19 (Fig. S3).

