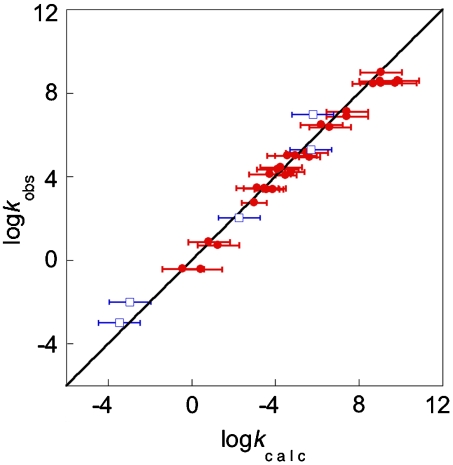
Fig. 2.
Comparison between HAT rate constants measured experimentally (kobs) vs. those from the CR/KSE model (kcalc). The line indicates perfect agreement. The reactions (Table 4) involve oxyl radicals +O-H bonds (•) or C-H bonds (□). The correlation coefficient (R2) for all data is 0.97.

