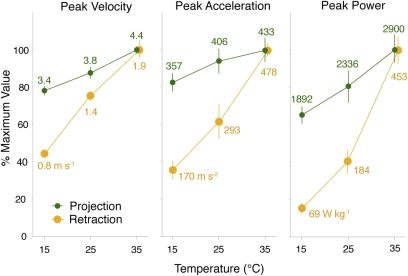
Fig. 2.
Performance parameters (mean ± SE) as a percent of maximum for tongue projection and retraction, showing low thermal dependence of projection (green) compared with retraction (gold). Absolute values of means are shown in native units. Values were calculated as the average of each individual's value for that parameter; individual values were interpolated at an average projection distance of 12.5 cm (from performance values regressed against projection distance).

