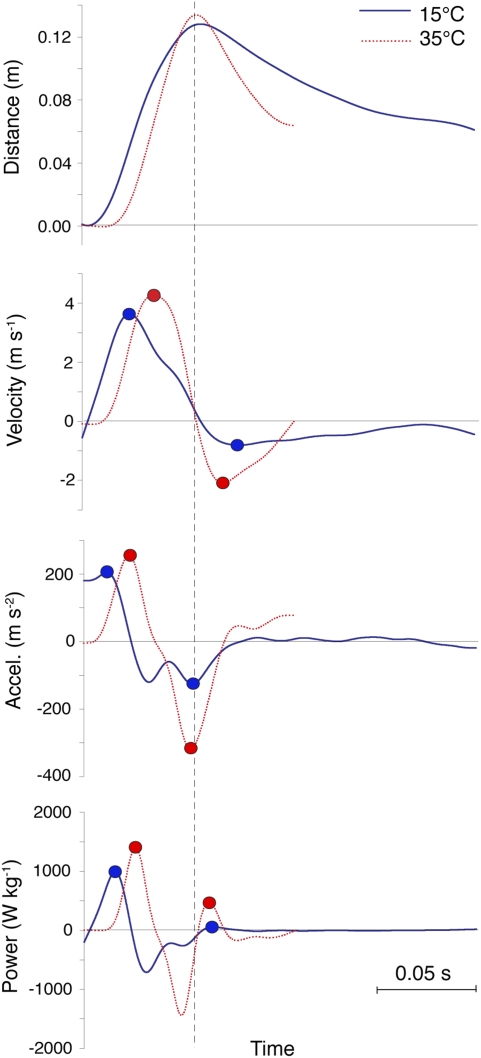
Fig. 3.
Kinematic and dynamic profiles from two representative feedings of similar projection distance showing similar peak values for projection at 15 °C and 35 °C, compared with dissimilar values for retraction at the two temperatures. Retraction is analyzed only until the tongue reaches the entoglossal process. Profiles are overlaid at the time of maximum projection distance (dashed line). Power values are not corrected for muscle mass (2× for projection and 4× for retraction).

