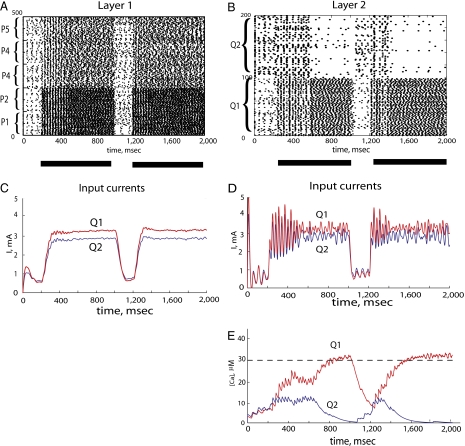
Fig. 4.
(A) Rastergram of the excitatory neurons in populations P1–P5. The first presentation of the stimulus started at 200 msec and terminated at 1,000 msec (black bar beneath the rastergram). The second presentation started at 1,200 msec and ended at 2,000 msec. As in Fig. 4, population P1 and P2 neurons received stronger inputs than population P3, P4, and P5 neurons; during the first presentation of the stimulus, spike time synchrony occurred among neurons of all five populations, and during the second presentation, synchrony was observed mainly among neurons in populations P1 and P2. (B) Rastergram of the excitatory neurons in populations Q1 and Q2. Competition between population Q1 and Q2 neurons (attributable to strong reciprocal inhibitory connections) led to population Q1 neurons suppressing the activity of population Q2 neurons. It took 400 msec (from 200 to 600 msec) for population Q1 neurons to suppress firing on population Q2 neurons in the first presentation of the stimulus, but it only took 200 msec (from 1,200 to 1,400 msec) for the second presentation of the stimulus. (C) Low-pass-filtered total synaptic currents to the excitatory neurons in population Q1 (red) and population Q2 (blue). On average, population Q1 neurons received stronger input than population Q2 neurons; however, amplitudes of the synaptic currents to both populations did not differ significantly during the first and second presentations. (D) Unfiltered total synaptic currents in the excitatory neurons in populations Q1 (red) and Q2 (blue) showed differences between the first and second presentations of the stimulus. Because the currents to the neurons in both populations originated from the synchronized neurons in P1–P5 populations, the currents in population Q1 and Q2 neurons were correlated. However, the correlation between the currents was weaker and shorter for the second presentation of the stimulus. (E) Temporal dynamics of the total calcium concentrations in population Q1 neurons (red) and population Q2 neurons (blue). When correlation between oscillatory inputs to neurons in populations Q1 and Q2 is strong (from 200 to 600 msec), neural activity in populations Q1 and Q2 coexists. Once correlation in inputs decreases, the winner-take-all nature of the network is observed. For the second presentation of the stimulus, the duration of strong correlation was much shorter (from 1,200 to 1,400 msec), which resulted in faster suppression of population Q2 neuron activity.

