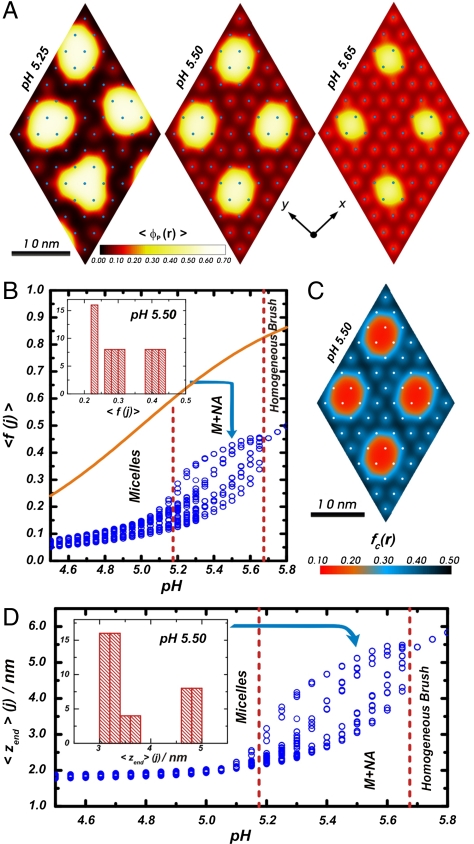
Molecular organization in the micelles and non-aggregated chains coexistence regime. (
A) Polymer volume fraction color maps along a plane parallel to the surface (
z = 2.0 nm) for the M + NA morphology at different bulk pHs. (
B). Average fraction of charged groups per chain
j as a function of solution pH. There is one symbol per chain, i.e., for each bulk pH there are 64 symbols. The
Orange Solid Line represents the dissociation fraction for an isolated acid group in the bulk isotropic solution. 〈
f(
j)〉 is defined as an average of the fraction of charged groups over all segments and conformations, i.e.:
where
PP(
α,
j) is the probability that polymer
j is found in conformation
α;
fc(
r) is the fraction of charged groups at
r and
n(
r,
α,
j) is the number of polymer segments that polymer
j in conformation
α has at
r. (
C) Color map for the local fraction of charged groups,
fc(
r) along a plane parallel to the surface at
z = 2.0 nm for pH 5.50 (corresponding to the middle case in
A). (
D) Average free-end z-position as a function of solution pH.

, where
zend(
α,
j) is the height (
z-position) of the free-end segment of polymer
j in conformation α. In
B and
D,
Vertical Red Lines delimitate pH regions corresponding to different morphologies.
Insets show histograms for pH 5.50. For all cases, the calculation corresponds to:
χc/
χ = 0.53,
n = 50,
NP/
A = 0.111 chains/nm
2,
Csalt = 0.1 M, and pK
a = 5.0.

 , where zend(α,j) is the height (z-position) of the free-end segment of polymer j in conformation α. In B and D, Vertical Red Lines delimitate pH regions corresponding to different morphologies. Insets show histograms for pH 5.50. For all cases, the calculation corresponds to: χc/χ = 0.53, n = 50, NP/A = 0.111 chains/nm2, Csalt = 0.1 M, and pKa = 5.0.
