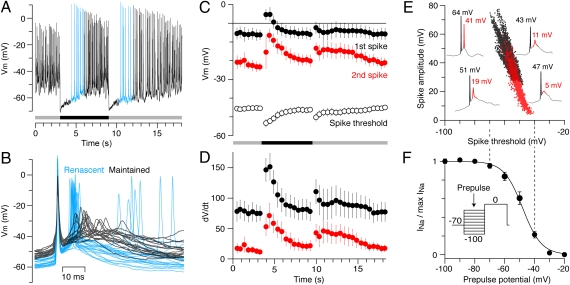
Fig. 4.
Light-evoked hyperpolarization of the UDs increases the amplitude of the renascent spikes, reflecting removal of voltage-gated Na+-channel inactivation. (A) Perforated-patch current-clamp recording from a UD in response to a flashed dark spot. (B) Complex spikes aligned to the peak voltage of the first spike; renascent spikes (blue) are larger, faster, and more likely to produce a third spike than maintained spikes (black). (C–E) The effects of light-evoked hyperpolarization on the properties of complex spikes (n = 4, ± SEM.). (C) The absolute peak voltage of the first spike (black circles) and second spike (red circles) within each burst, and the spike threshold of the first spike (open circles); the spike threshold was measured 1 ms prior to the rate of rise reaching 40 V/s and reflected the initial membrane potential. (D) The maximum rate of rise (dV/dt) of the first spike (black circles) and second spike (red circles). (E) Individual spike amplitudes for the first spike (black symbols) and second spike (red symbols) plotted against the spike threshold; example traces are taken from the cell in A,> illustrating the variability in amplitudes of the first (black) and second (red) spikes. (F) Mean steady-state inactivation (n = 5, ± SEM) of Na+ currents measured by prepulses at different potentials (Inset) and fitted with a Boltzmann function (solid line; Vhalf = –48 mV, k = 6.3 mV); the onset of inactivation mirrors the decline in spike amplitude and increase in spike thresholds mapped in E. Pulse protocol: holding potential at –70 mV, 50 ms prepulse at potentials from –100 mV to –20 mV in 10-mV steps, and 100-ms test pulse at 0 mV.

