Fig. 5.
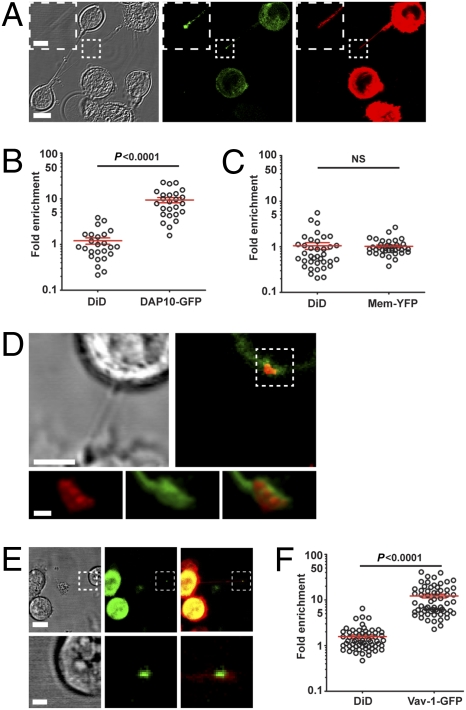
Accumulation of DAP-10, Vav-1, and tyrosine-phosphorylated proteins at nanotube junctions. (A) Representative micrograph (n > 100) shows NKL transfected to express DAP10-GFP (green) labeled with membrane dye DiD (red), which is connected to THP-1 (Lower Left in bright-field image) via a nanotube. Panels show the bright-field image of cells and the corresponding fluorescence of DAP10-GFP (green) and DiD (red). Also evident in this image is a membrane connection between two THP-1 cells (shown in the bright-field image; not fluorescent). Using transfectants of NKL expressing DAP10-GFP or mem-YFP and THP-1, the fold increase at nanotube junctions of DAP10-GFP and DiD (n = 25) (B) or mem-YFP and DiD (n = 37) (C) was measured in comparison with that elsewhere along the nanotube. (D) NKL coincubated with P815/MICA-YFP was fixed and stained for phosphotyrosine (red). The boxed region is shown enlarged to allow better visualization of the accumulation of phosphotyrosine (red) along with MICA-YFP (green, n = 20). (E) Representative micrograph shows NKL transfected to express Vav-1 tagged with GFP, stained with DiD (red), and cocultured with P815/MICA. Panels show the bright-field image and corresponding fluorescence of Vav-1-GFP (green) and an overlay (Right, n = 60). The boxed regions are shown enlarged in lower panels to visualize the nanotube junction better. (F) Using transfectants of NKL expressing Vav-1-GFP and P815/MICA, the fold increase at nanotube junctions of Vav-1-GFP and DiD was measured in comparison with that elsewhere along the nanotube. [Scale bars: 10 μm (inserts: 2 μm).]

