
Table 3.
Summary of  concentrations and τoverall estimated using Eq. [9] and
| Sample date | dpm per sample | 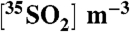 |
τoverall (days) |
| SFV | |||
| 7/21/2008 | 4.80 ± 0.19 | 436 ± 17 | 10.6 ± 0.4 |
| 7/25/2008 | 9.03 ± 0.18 | 820 ± 16 | 20.0 ± 0.4 |
| 7/28/2008 | 6.21 ± 0.17 | 565 ± 16 | 13.8 ± 0.4 |
| 8/1/2008 | 10.07 ± 0.19 | 915 ± 18 | 22.3 ± 0.4 |
| SIO | |||
| 7/21/2008 | 0.10 ± 0.19 | 9 ± 17 | 0.2 ± 0.4 |
| 7/25/2008 | 1.19 ± 0.17 | 108 ± 15 | 2.6 ± 0.4 |
| 7/28/2008 | 2.02 ± 0.19 | 184 ± 17 | 4.5 ± 0.4 |
| 8/1/2008 | 1.81 ± 0.14 | 165 ± 12 | 4.0 ± 0.3 |
Air volume per sample (Vair) was equal to 2,000 m3 and the total number of 35S(35N) in each sample was determined using the relationship: 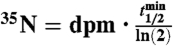 , where
  is the radioactive-decay half-life of 35S expressed in minutes and dpm is the measured activity of the sample in units of disintegrations per minute. The air volume concentrations of 35S were calculated as
 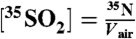 .
.