Fig. 1.
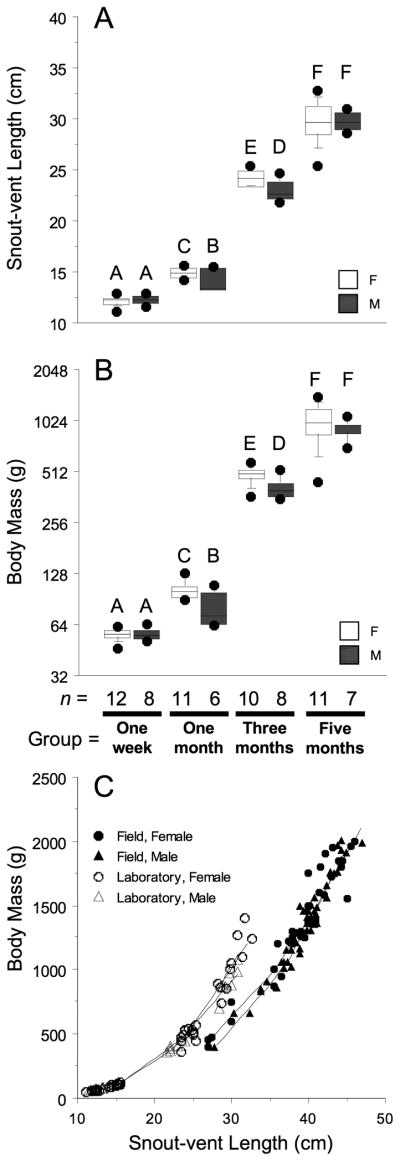
Box plot diagrams of A: snout-vent length and B: body mass (note log2 scale) for dissected animals grouped by age and sex (open boxes = female; grey boxes = male). Boxes define 75th to 25th percentiles and are bisected by the mean values. Whiskers define 90th and 10th percentiles with outliers (filled circles) above and below. Superscripts over boxes denote differences between groups (P > 0.05). Sample sizes for each group are set below graphs. C: A scatterplot diagram of snout-vent length and body mass for laboratory-raised animals (open figures) and field-captured, Lake Woodruff juvenile animals (solid figures). Males = triangles; females = circles. Individual locally weighted scatter plot smoother (LOWESS) curves (tension = 50) are plotted for each group.

