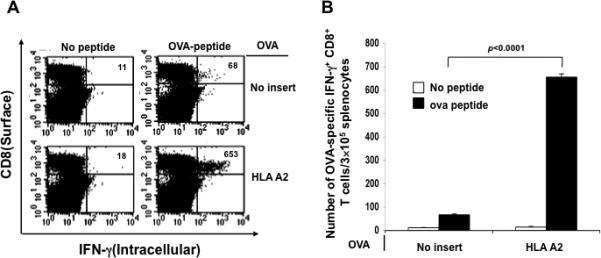
Figure 4. Intracellular cytokine staining followed by flow cytometry analysis to characterize the OVA-specific CD8+ T cell immune response in vaccinated mice.

C57BL/6 mice (5 per group) were immunized with pcDNA3 OVA mixed with pcDNA3 HLA-A2 or no insert intramuscularly followed by electroporation twice with a 1-week interval. One week after the last vaccination, splenocytes from vaccinated mice were harvested and stimulated with the OVA peptide. Cells were characterized for OVA-specific CD8+ T cells using intracellular IFN-γ staining followed by flow cytometry analysis. Splenocytes without peptide stimulation were used as negative control. (A) Representative data of intracellular cytokine staining followed by flow cytometry analysis showing the number of OVA-specific IFNγ+ CD8+ T cells in the various groups (right upper quadrant). (B) Bar graph depicting the numbers of OVA-specific IFN-γ-secreting CD8+ T cells per 3×10⁵ pooled splenocytes (mean± s.d.).
