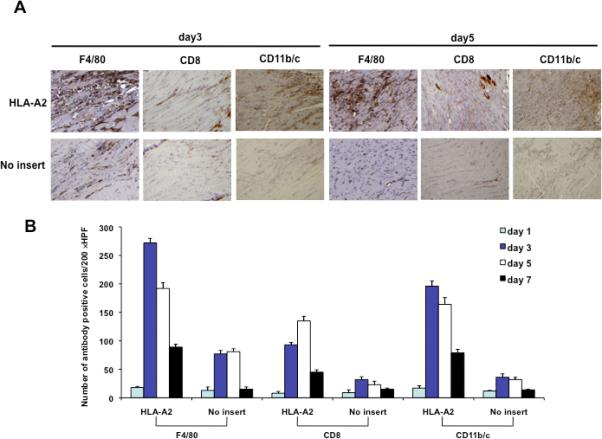
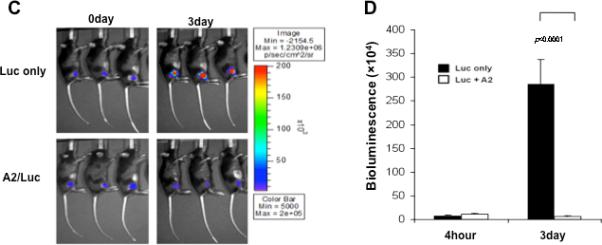
Figure 6. Characterization of the infiltrating CD8+ T lymphocytes as well as CD11b/c+ antigen presenting cells and kinetics of protein expression in the injection site following administration of HLA-A2 DNA.


(A) Representative immunocytochemistry images of muscle sections from mice injected with or without HLA-A2 DNA. C57BL/6 mice were injected with 1ug of pcDNA-no insert or HLA-A2 plasmid DNA by electroporation-mediated i.m. injection. Muscle sections from the site of injection was removed on day 3 and 5. Sections were stained with hematoxylin-eosin, F4/80, CD8, and CD11b/c antibody. (B) 5-(B) Graphical representation of the number of F4/80, CD8, and CD11b/c positive cells per 200× HPF. The data were generated using 200 × HPF from 3 different fields for each muscle tissue and shown as mean±s.d. The data presented in this figure are from one representative experiment of two performed. (C) Representative luminescence images of mice injected with pcDNA3-HLA-A2/Luc or Luc plasmid DNA on day 0 and day 4. C57BL/6 mice (3 per group) were injected with 1ug of pcDNA3-HLA-A2/Luc or Luc plasmid DNA intramuscularly followed by electroporation. The intensity of bioluminescence was checked on days 0 and 3 after injection. Image on day 0 was taken 4 hours after injection. (D) Bar graph depicting quantification of luminescence intensity in mice injected with pcDNA3-HLA-A2/Luc or Luc plasmid DNA (mean ± S.D.). Data shown are representative of two experiments performed.
