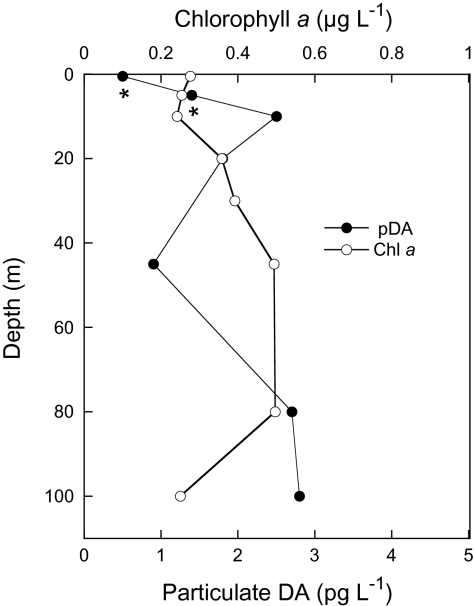
Fig. 2.
A profile of particulate DA and phytoplankton biomass as a function of depth at OSP in June 2006. Discrete samples were collected using 10-L Niskin bottles; generally 7.3-L subsamples were filtered for pDA (•) and analyzed fresh at sea using a cELISA; 0.2-L subsamples were filtered for total phytoplankton biomass as chlorophyll a (○) on Whatman GF/F filters (nominal pore size, 0.7 μm) and analyzed fluorometrically (33). Values below the volume-adjusted MDL of 1.8 pg L−1 for all samples (7.3 L), except the 45 m depth sample (50 L) (volume-adjusted MDL, 0.5 pg L−1), are reported with an asterisk.

