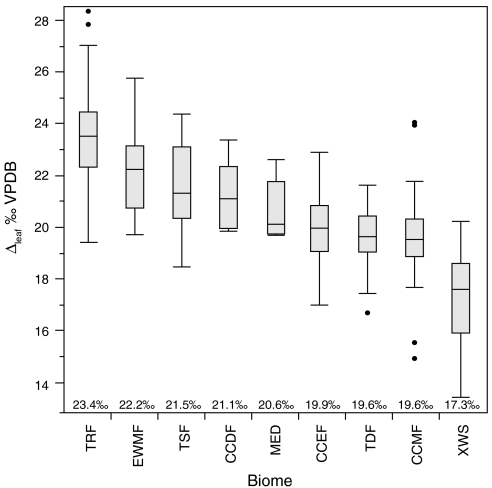
Fig. 3.
Box and whisker plots of Δleaf values by biome. Biome accounts for 66% (p < 0.0001) of the variability in Δleaf in an ANOVA model. Number of samples per biome are as follows (see Fig. 1 caption for abbreviations): TRF = 206; EWMF = 29; TSF = 47; CCDF = 5; MED = 5; CCEF = 53; CCMF = 78; TDF = 26; XWS = 59. Statistical tests of means are shown in SI Appendix.

