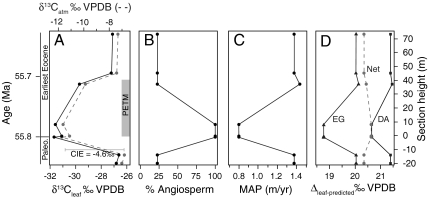
Fig. 4.
Conceptual diagram of  reconstruction for latest Paleocene to earliest Eocene sediments in the Bighorn Basin (WY). The figures are constructed as follows: (A)
  values as inferred from δ13C values of n-C31 alkanes (2), (B) percent of fossil leaves that are angiosperms, (C) mean annual precipitation (MAP) derived from fossil leaf metrics (9, 28), and (D) modeled net Δleaf from our Δleaf-MAP expressions for evergreen gymnosperm (EG; triangles) and deciduous angiosperm (DA; squares) PFTs (see SI Appendix). Each model was scaled by % angiosperm to derive a net Δleaf (dashed line).
  is denoted with a dashed line on A and is derived from the net Δleaf and
  values. The negative CIE in
  at the base of the Paleocene-Eocene Thermal Maximum (PETM) is 4.6% (difference between latest Paleocene value and average of initial PETM values). See SI Appendix for discussion of calculations and suggested use of these models.

