Fig. 3.
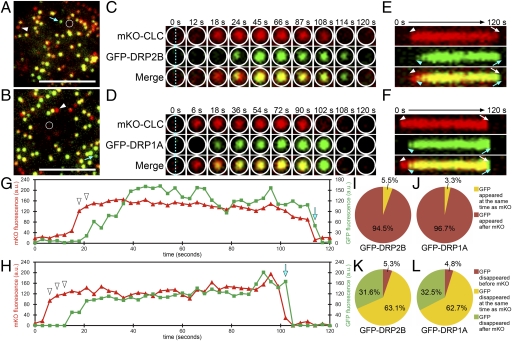
Behaviors of DRP2B and DRP1A at CLC assembly sites at the plasma membrane. (A and B) VIAFM images of Arabidopsis cultured cells expressing mKO-CLC (in red) and GFP-DRP2B (A) or GFP-DRP1A (B) (in green) at the beginning of time-lapse observation covering 120 s. Blue arrows and white arrowheads in A and B indicate GFP- and mKO-only foci, respectively. (Scale bars: 5 μm.) (C and D) Ten frames of the region surrounded by white lines in A and B are from Movies S1 and S2. Top, Middle, and Bottom in each column represent mKO, GFP, and merged images, respectively. (E and F) Kymographs representing the fluorescence on the blue dotted lines of C and D. Top, Middle, and Bottom represent mKO, GFP, and merged images, respectively. Arrowheads and arrows in white and blue indicate the appearance and disappearance timing of mKO and GFP signals, respectively. (G and H) Time-intensity profiles of mKO-CLC fluorescence (red lines) and GFP-DRP2B (G) or GFP-DRP1A (H) fluorescence (green lines) within the areas surrounded by white lines in A and B. (I and J) Pie charts showing the percentage of the foci in which GFP-DRP2B (I) and GFP-DRP1A (J) appeared at the same time as (yellow) or after (red) mKO-CLC for 120 s. (K and L) Pie charts showing the percentage of the foci in which the fluorescence of GFP-DRP2B (K) and GFP-DRP1A (L) disappeared before (red), at the same time as (yellow), or after (green) mKO-CLC for 120 s.

