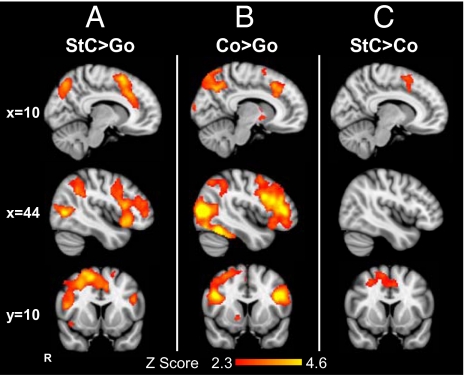
Fig. 2.
Frontal activation during response inhibition. Rendered images show brain regions activated in the controlled SST for (A) correct stop (StC) more than correct go trials (StC > Go); (B) correct continue trials more than go trials (Co > Go); and (C) correct stop trials more than continue trials (StC > Co). Results are superimposed on the MNI 152 T1 2 mm brain template. For the whole-brain analysis, a Z-statistic threshold of 2.3 was employed, combined with a corrected cluster significance threshold probability of P < 0.05.

