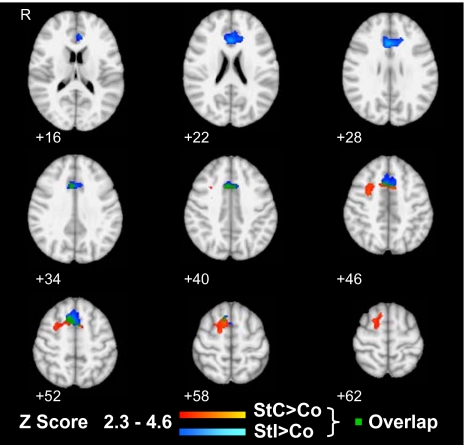
Fig. 3.
Distinct medial frontal activations for successful response inhibition and error processing. Regions showing greater activation during the controlled SST in light to dark blue for incorrect stop trials (StI) and in yellow to red for correct stop trials (StC) compared with correct continue trials (Co). Overlap between these contrasts is shown in green. Activations are superimposed on axial sections from z = 16 to z = 62. Thresholding and overlay are as in Fig. 2.

