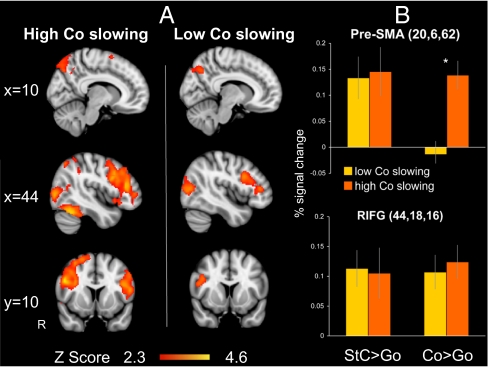
Fig. 4.
Increased pre-SMA activation during response slowing. (A) Rendered images for the first run of the controlled SST showing brain regions activated for the contrast Co > Go when subjects slow their response to the Continue signal (high Co slowing) or respond as quickly as in Go trials (low Co slowing). Thresholding and overlay as in Fig. 2. (B) Percentage signal change within the right caudal/lateral pre-SMA and right inferior frontal gyrus (RIFG) for the two contrasts stop correct (StC) > go and continue correct (Co) against go (±SEM). *P < 0.05 in activation between the two groups in pre-SMA activation for continue versus go trials.

