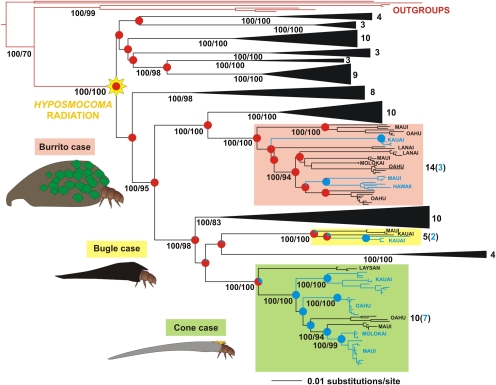
Fig. 3.
Phylogeny of Hyposmocoma moths based on molecular data with the three lineages including amphibious species highlighted. Shown is the maximum likelihood tree based on combined analysis of three genes: the mitochondrial gene cytochrome oxidase subunit I and the nuclear genes elongation factor 1α and carbomoylphosphate synthase. Bayesian posterior probabilities ≥95 and nonparametric bootstrap supports ≥70 are given under each corresponding node and clade. This topology is congruent with the Bayesian topology (Fig. S3). Numbers on the right of the different terrestrial clades represent species per clade, with blue numbers in brackets representing total of aquatic species. Proportional likelihoods of ancestral states are mapped onto each node of interest (red = terrestrial; blue = aquatic); exact values are given in Fig. S6. Branch lengths are drawn to scale, as indicated by scale bars.

