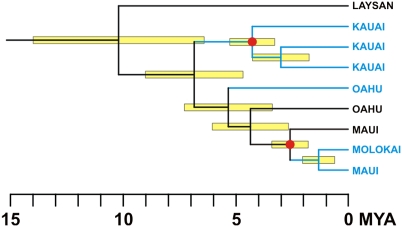
Fig. 4.
Maximum clade credibility chronogram inferred using the uncorrelated relaxed clock model of rate evolution. Error bars represent 95% posterior credibility intervals and are only given for nodes that were present on more than 50% of the posterior sampled trees. Red filled circles represent the two nodes used for calibration. Ages are given in millions of years before present.

