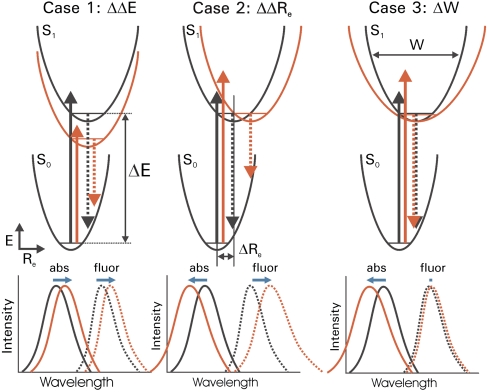
Fig. 2.
Strategy for probing excited state surfaces in spectral tuning. Three archetypal changes in energy surfaces by mutations and the resulting spectral tuning effects for absorbance and fluorescence emission spectra are shown. The energy surfaces, electronic transitions, and spectra for both the wild-type protein (black) and mutant protein (red) are indicated schematically for each of the three cases. Changes in both peak position and shape of the absorbance spectra (solid lines) and fluorescence emission spectra (dotted lines) are depicted. Shifts in the positions of the absorbance and fluorescence emission maxima are indicated by horizontal blue arrows. In case 1, which represents the classical explanation of spectral tuning, the energy gap ΔE between the electronic ground state S0 and the first electronically excited state S1 is altered. In case 2 the difference in nuclear equilibrium geometry ΔRe is altered. In case 3 the width W of the S1 energy surface is altered.

