Fig. 3.
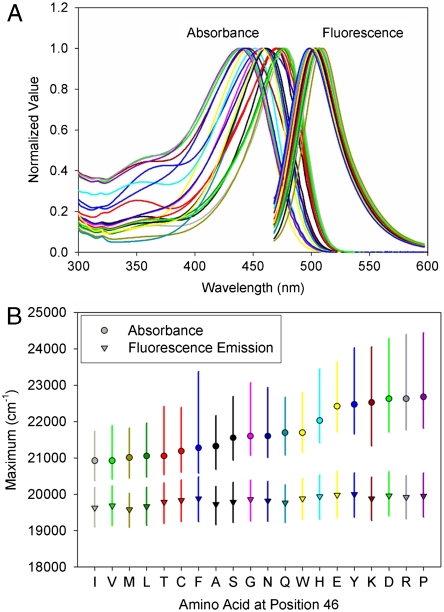
Absorbance and fluorescence emission spectra of the 20 E46X mutants of PYP. (A) The amplitude-normalized absorbance and fluorescence emission spectra of the E46X mutants are shown. (B) Analysis of positions and bandwidths of the E46X mutants. Absorbance (closed circles) and fluorescence emission (open circles) maxima are indicated. The vertical bars depict the width of the spectra at 3/4 height. The horizontal axis represents the residue substituted at position 46. The residues were sorted from most red-shifted to most blue-shifted absorbance maximum.

