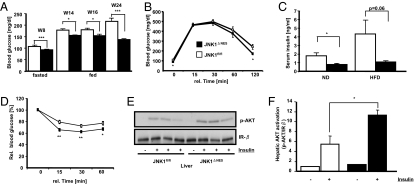
Fig. 4.
JNK1ΔNES mice show improved glucose homeostasis and elevated insulin sensitivity. (A) Fasted and fed blood glucose concentration of JNK1fl/fl (▫) and JNK1ΔNES (■) mice on high-fat diet at the indicated ages (n = 10–25 per group). (B) Intraperitoneal glucose tolerance test in JNK1fl/fl (▫) and JNK1ΔNES (■) mice on high-fat diet at the age of 14 weeks (n = 10 per group). (C) Serum insulin concentrations in JNK1fl/fl (▫) and JNK1ΔNES (■) mice on normal and high-fat diet at the age of 8–10 weeks (n = 8 per group). (D) Intraperitoneal insulin tolerance test in JNK1fl/fl (▫) and JNK1ΔNES (■) mice on high-fat diet at the age of 15 weeks (n = 9–10 per group). (E) Insulin-stimulated hepatic AKT-phosphorylation in JNK1fl/fl and JNK1ΔNES mice on high-fat diet at the age of 12 weeks (n = 3 per group). (F) Quantification of insulin-stimulated hepatic AKT phosphorylation as shown in Fig. 4E. Displayed values are means ± SEM. *, P ≤ 0.05; **, P ≤ 0.01; ***, P ≤ 0.001.

