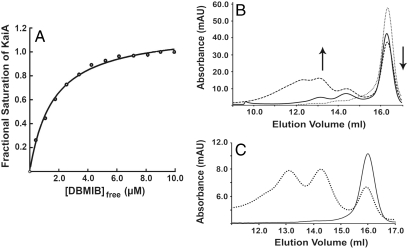
Fig. 3.
Quinone binding and KaiA aggregation state. (A) One of three equivalent trials of KaiA fluorescence quenching by titration of DBMIB. x axis, concentration of free DBMIB in solution as calculated by Eq. 4; y axis, fractional saturation of KaiA as calculated by Eq. 3. (B) Chromatogram from gel filtration analysis of KaiA135N with 0, 3, and 5 molar equivalents of oxidized DBMIB. Arrows indicate the increase in oligomeric species and the concomitant decrease in monomeric KaiA135N with increasing quinone concentration. (C) Chromatogram from gel filtration analysis of KaiA135N with 5 M equivalents of oxidized DBMIB (dotted line) and 5 M equivalents of DBMIB and sodium dithionite (solid line).

