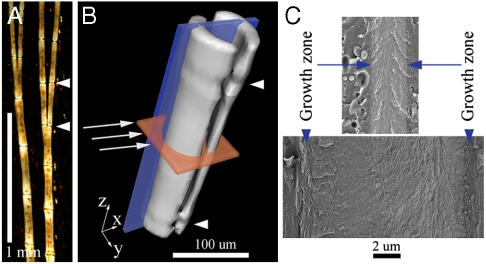
Fig. 1.
(A) Representative polarized light micrograph showing two bony rays, bifurcating distally, photographed within the caudal fin tissue of a TL zebrafish. (B) A fin bony ray segment reconstructed from x-ray microcomputed tomography, showing the geometry of the measurements performed. Each ray is composed of many segments (one segment is shown between the two white arrowheads in A and B, ∼300 μm long) and each segment is composed of two hemirays (B) held together by soft tissue. Continuous ray growth occurs by addition of new segments to the distal end (top in A, z direction in B) and thickening of each segment (x and y directions in B). In B, white arrows indicate the x-ray beam (diameter 10 μm) direction in the microbeam measurements. Two planes are marked in red and blue that represent two orientations in which the samples were observed in cryo-SEM (red: transverse sections; blue: longitudinal fracture surfaces). (C) Cryo-SEM micrographs of longitudinal fracture surfaces (blue plane in B) through native, high pressure frozen mature bone (Bottom) and younger bone (Top), represented on the same scale. The difference in bone thickness reflects the continuous thickening of the segments. Growth zones at the bone edges are indicated.

