Fig. 3.
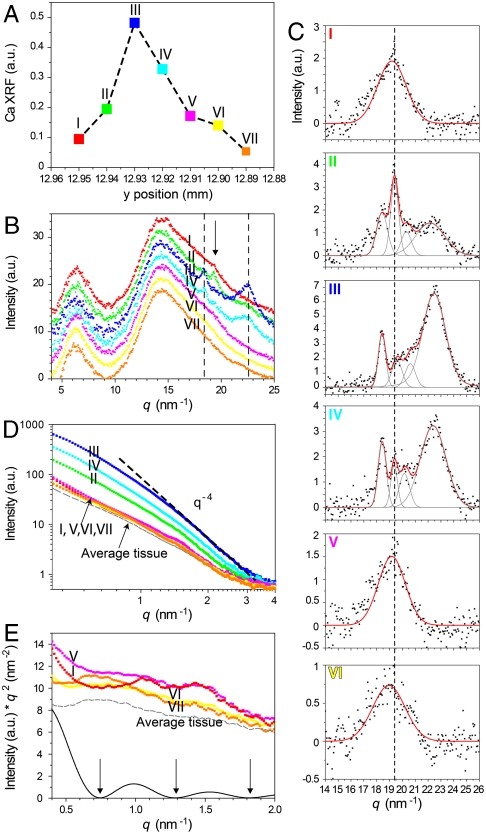
Calcium XRF (A), WAXD (B and C), and SAXS (D and E) profiles of a representative line scan transverse to the fin bone long axis, indicated by rectangles in Fig. 2B. (A) Calcium levels highlight the bone profile: Highest reading (blue, III)—center of the bone; red (I), magenta (V), and yellow (VI)—bone edges/growth zones; orange (VII)—organic tissue outside the bone. The same color code and numbering are used to indicate measurement position across the bone throughout the figure. (B) The WAXD patterns are dominated by two very broad peaks originating from the organic tissue. Curves were normalized to the curve representing the tissue scattering at q = 9–14 nm-1, and the intensity was shifted arbitrarily for simplified visualization; dashed black lines—carbonated hydroxyapatite reflections in the green-cyan (II–IV) curves; arrow—broad peak in the red and magenta (I, V) curves. (C) Data plotted in B (I–VI) after tissue background subtraction and peak fitting; gray lines—individual fitted peaks; red lines—overall fit. In III and IV, crystalline carbonated hydroxyapatite diffraction peaks appear at 18.4 nm-1 (002), 20.5 nm-1 [unresolved (102) and (210) reflections], and 22.5 nm-1 [unresolved (211), (112), and (300) reflections]. In I, V, and VI, a disordered phase appears at 19.4 nm-1 (Dashed Line), which becomes crystalline (Sharp Peak) in II and IV. (D) SAXS profiles plotted on a double-logarithmic scale. Green-cyan (II–IV) produce typical bone SAXS following Porod’s approximation (slope q-4). Measurements from bone edges and within the organic tissue produce different, low intensity scatter, better resolved in E. The dashed gray line is an average of 4 measurements from organic tissue at different locations, arbitrarily shifted in intensity. (E) Data multiplied by q2 and plotted on a linear scale (Kratky plot). Red (I) and magenta (V) show two distinct minima (0.75 and 1.29 nm-1) that coincide with minima produced in the calculated SAXS for monodisperse spheres of radius 6 nm (Black Curve, Arrows). Organic tissue gives a maximum at 0.7 nm-1; the yellow (VI) curve has much scattering contribution from the organic tissue.

