Fig. 4.
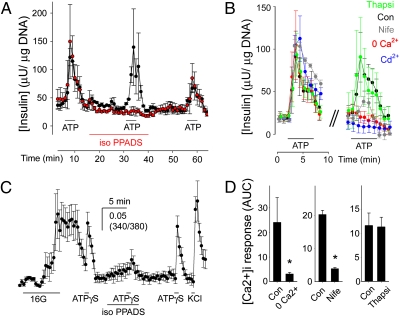
ATP-induced insulin release by human β cells requires P2X receptor activation and Ca2+ influx through voltage-gated Ca2+ channels. (A) Insulin secretion induced by ATP (10 μM) was inhibited in the presence of iso-PPADS (50 μM). Average traces from three islet preparations ± SEM with (red symbols) and without (black symbols) incubation in iso-PPADS. Bars indicate drug or antagonist application. (B) Insulin secretion induced by ATP (10 μM) was reduced in nominal 0 Ca2+ (+1 mM EGTA; red symbols) or in the presence of the Ca2+ channel blockers Cd2+ (100 μM; blue symbols) or nifedipine (Nife; 10 μM; gray symbols). Thapsigargin treatment (Thapsi; 1μM; green symbols) did not affect insulin responses. Average insulin response of three islet preparations (± SEM) before (Left) and during treatment (Right). Con, control insulin response to ATP (black symbols). (C) Iso-PPADS reduced [Ca2+]i responses induced by ATPγS (50 μM) in human β cells. Only islet cells that responded to high glucose (16 mM) were examined. Bars indicate the duration of the stimulus or antagonist application. Average trace is shown (7 cells ± SEM). (D) [Ca2+]i responses induced by ATPγS (50 μM) were reduced in nominal 0 Ca2+ (+1 mM EGTA) or in the presence of nifedipine (10 μM). [Ca2+]i responses to ATPγS were not decreased in the presence of thapsigargin (1 μM). Shown is the average peak response amplitude ± SEM of ≥3 cells from three human islet preparations. Asterisks denote statistical significance (Student t test; P < 0.05). Con, control [Ca2+]i response to ATPγS before treatment; AUC, area under the curve.

