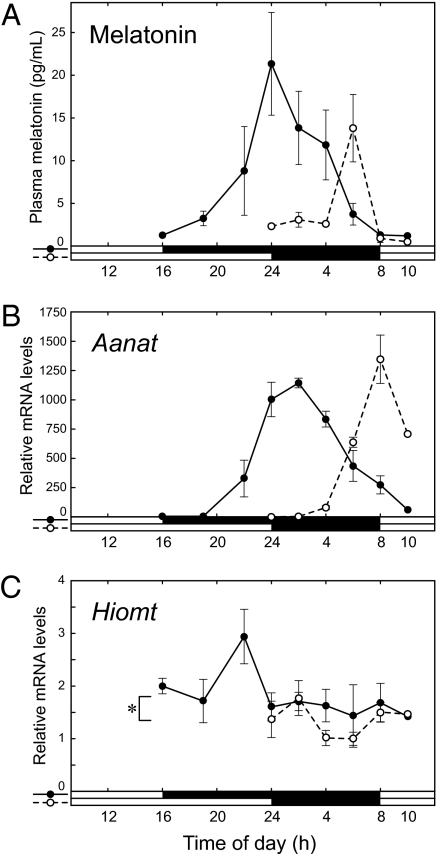
Fig. 4.
Photoperiodic change in melatonin synthesis and secretion. (A) Nocturnal melatonin secretion profiles of MSM mice maintained in short-day and long-day photoperiods. Plasma melatonin levels of mice in LD8:16 (closed circles and solid line) and in LD16:8 (open circles and dashed line) were assayed using ELISA (mean ± SD, n = 3; except for 16:00 and 10:00, n = 1). (B, C) Nocturnal Aanat (B) and Hiomt (C) mRNA profiles in short-day and long-day photoperiods. Pineal glands were collected from the mice shown in A. Aanat, Hiomt, and Actb mRNAs were assayed by RT-PCR. Aanat and Hiomt mRNA levels normalized to Actb mRNA were shown as values (mean ± SD, n = 3; except for 16:00 and 10:00, n = 1) relative to the lowest values (Aanat, 24:00 of mice in LD16:8; Hiomt, 6:00 of mice in LD8:16). Nocturnal Hiomt mRNA level was significantly increased under short-day photoperiod (*P < 0.02). In this statistical analysis, which was performed by using R, we used a general linear model with two factors, photoperiod and ZT, following to conversion of local time (time of day) into ZT. For example, 4 AM in a short LD8:16 photoperiod is ZT21, and the same local time in a long LD16:8 photoperiod is ZT18.

