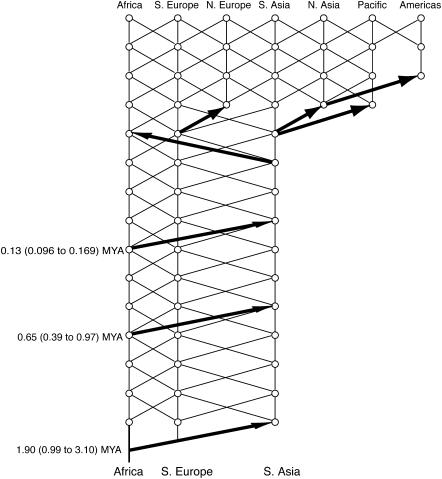
Fig. 4.
The model of human evolution based on the falsification of null hypotheses under NCPA. The thick black arrows indicate major events in population range expansion. The trellis indicates gene flow. The dating and 95% confidence intervals for the three major out-of-Africa expansions are based solely on the molecular genetic data. Further details are in refs. 27–29.

