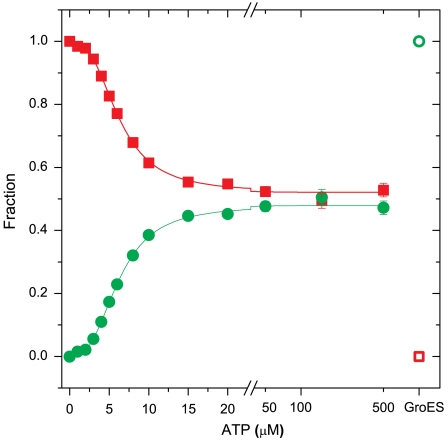
Fig. 3.
The fractions of the T and R states (in Red Squares and Green Circles, respectively), as obtained from SVD analysis of curves measured at varying ATP concentrations, using a quantum efficiencies ratio of 2.5. At ATP saturation, the fraction of the R state is not more than 50%. The empty symbols designate the fractions in the presence of GroES. The full lines are the results of a fit to a Hill-like function with a Hill coefficient of 2.7 ± 0.1.

